
Newcastle Property Investors Guide (2026)
Newcastle has long been one of the North East’s most attractive locations for property investors, but success here depends on understanding the local micro-markets, demand drivers, and restrictions.
This guide is designed to give investors a clear, realistic overview of property investment in Newcastle, based on current market knowledge rather than headlines or hype. thrive.
Newcastle Property Market Snapshot — Growth Subzones & Rental Dynamics
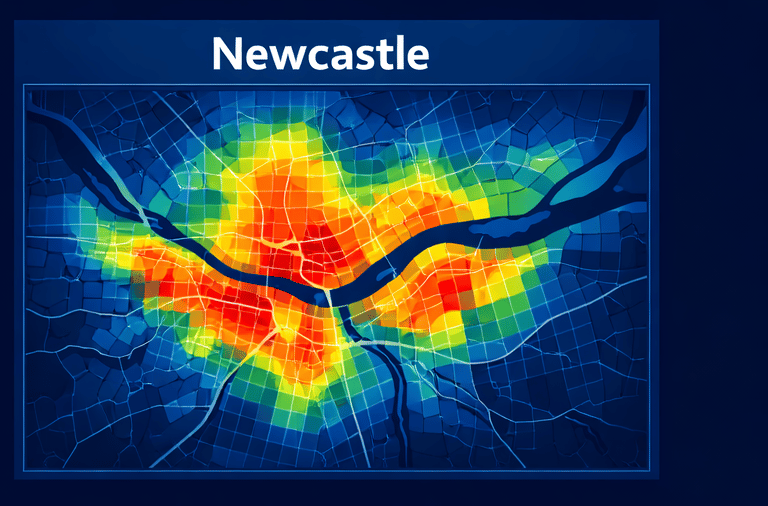
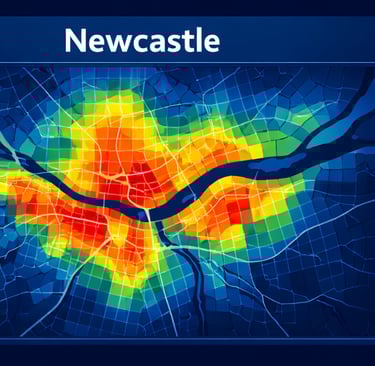
I’ve been studying the latest 12-month sale value change heatmap for Newcastle & Gateshead, and the patterns are telling a clear story for investors:
🔥 Key Growth Areas
Based on the Bricks & Logic data:
West Newcastle
Fenham / Benwell – solid mid-range gains (deeper red on heatmap)
Significant buyer attraction due to value vs proximity to city centre
Strong and stable rental demand from local workforce / students
North/East of City Centre
Byker / Walker / Heaton fringes
Above-average growth compared to central core
Continued regeneration and buoyant rental market
Gateshead
Zones around Team Valley / Low Fell / Bensham
Good mix of owner-occupier and investor interest
Value-driven areas gaining momentum as affordability tightens elsewhere
Where central Newcastle (Haymarket/Quayside) is still moving, the pace of growth is greater in these value-oriented neighbourhoods, especially where rental demand is high.
💷 Rental Price Context (Current Local Averages)
(Note: approximate based on market data & recent listings)
LocationTypical 2-Bed RentTypical 3-Bed RentFenham / West End£850–£950 pcm£950–£1,150 pcmHeaton / Jesmond fringe£900–£1,050 pcm£1,100–£1,300 pcmByker / Walker£800–£925 pcm£900–£1,100 pcmGateshead (central / Team Valley)£800–£950 pcm£900–£1,200 pcmElswick / Arthur’s Hill£800–£900 pcm£900–£1,100 pcm
📌 Yields in these areas are often higher than the city centre, especially when purchase prices are lower but rents remain strong.
📈 What This Data Means for Investors
1. Price Growth Is Starting Outside the Core
The heatmap shows notable year-on-year value increases in neighbourhoods just outside the central core — especially areas that historically offer good rental returns.
This suggests that investors focusing purely on “prime postcode prestige” may be missing stronger growth signals in greater Newcastle and Gateshead commuter zones.
2. Rental Demand Remains Resilient
With rental prices still holding up well (and increasing in some value towns), the yield story remains strong in areas like Fenham, Byker, Elswick and Gateshead. These areas often produce stronger net yields compared to central Newcastle.
3. Interest Rate Tailwinds Coming
With the expectation of rate cuts into 2026, borrowing conditions may ease further — reinvigorating both owner-occupier demand and investor activity. This could accelerate price growth and competition in value-driven postcode clusters.
4. Strategy Implication
Investors should be thinking strategically:
Value plus demand beats “central only” exposure
Focus on rental sustainability and tenant base
Consider long-term growth corridors rather than short-term price spikes
📌 Takeaway
This heatmap isn’t just colour — it’s showing where demand is translating into value, particularly in areas that still represent strong rental yield and affordability.
📍 Fenham, Benwell, Byker, Walker, Elswick, and Gateshead are areas worth serious investor consideration right now.
If you’re thinking about:
Where to acquire next
Which postcodes are outperforming
How rate shifts will affect capital growth vs yield
…this data backs up what many of us have been feeling — the Newcastle & Gateshead market still rewards smart, locally-driven investment decisions.
© Northeast Property 2026. Northeast Property is a trading name of Northeast Starlight Property Limited, registered in England and Wales at 334 High Street, Jarrow NE32 3BH (company number 15227296)


